Understanding Linear Correlation: Definition, Use, and Interpretation
Linear correlation is a significant concept in statistics, defining the relationship between two variables. Understanding this relationship is crucial in diverse fields, from psychology to economics, physics to biology, and beyond. The linear correlation coefficient, also known as Pearson's correlation coefficient, is a statistical measure that quantifies the degree of the linear relationship between two variables.
Definition and Explanation of Linear Correlation
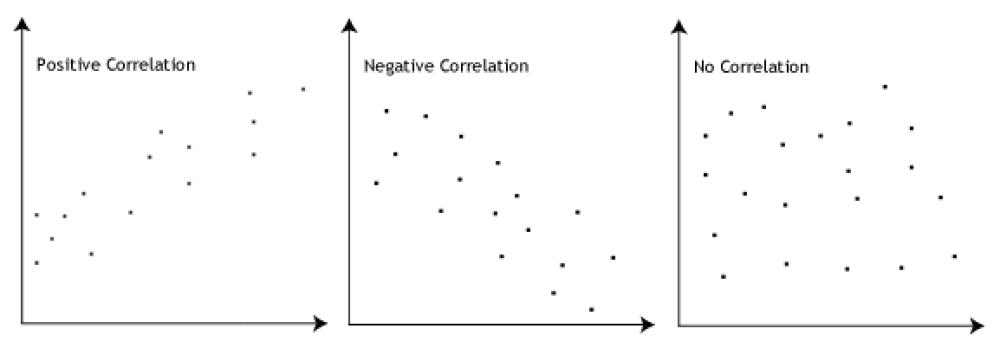
Linear correlation characterizes the relationship between two variables, X and Y, in terms of direction and strength. When the variables change consistently together—either increasing or decreasing—there is a positive correlation. If one variable increases while the other decreases, there is a negative correlation. If there is no consistent pattern of change between the variables, then they are said to have zero or no correlation.
The linear correlation coefficient (r), ranging between -1 and 1, measures the strength and direction of the linear relationship. An r value of 1 denotes a perfect positive linear relationship, -1 represents a perfect negative linear relationship, and 0 indicates no linear correlation.
Application and Interpretation
Linear correlation has vast applications in various fields, as it helps in predicting one variable based on the known value of the other. In economics, for instance, it can show the relationship between the GDP of a country and its unemployment rate. In psychology, it may elucidate the link between stress and physical health.
The value of the correlation coefficient provides significant insights. A high positive correlation (close to 1) implies that as one variable increases, the other also tends to increase. A high negative correlation (close to -1), on the other hand, suggests that as one variable increases, the other tends to decrease. A value close to 0 suggests a weak or no linear relationship between the variables.
While interpreting correlation, one should be aware of the "correlation does not imply causation" principle. A high correlation between two variables does not definitively establish that one variable's change causes the change in the other.
Limitations of Linear Correlation
While linear correlation is a powerful tool, it has its limitations. It only measures the strength of a linear relationship and may not detect other relationships such as quadratic or exponential ones. Additionally, the presence of outliers can dramatically influence the correlation coefficient, potentially leading to misleading interpretations.
Furthermore, it doesn't account for confounding variables, which might influence both variables under study. Thus, it's essential to complement correlation analysis with additional research methods to draw robust conclusions.
Linear correlation, represented by the correlation coefficient, offers a statistical measure that captures the strength and direction of the linear relationship between two variables. It serves as a fundamental tool for statistical analysis, allowing predictions, and unveiling relationships in various domains. Despite its limitations, the understanding and correct interpretation of linear correlation are critical for data-driven decision making in many fields. It's a stepping stone in the intricate world of statistical relationships, providing initial insights before delving deeper into more complex statistical models.
Here is an example problem;
Problem:
Dr. Brown is a psychologist interested in studying the relationship between hours spent on social media per day (X) and the levels of anxiety experienced by individuals (Y). He has collected the following data from a random sample of 10 individuals.
|
Dr. Brown wants to know if there's a significant linear correlation between the hours spent on social media and the level of anxiety. He decided to use Pearson's correlation coefficient to find this out.
Solution:
To calculate Pearson's correlation coefficient (r), we need to follow these steps:
1. Calculate the mean of X (X̄) and the mean of Y (Ȳ).
2. Subtract the mean from each observation to get deviations.
3. Square each deviation.
4. Multiply each deviation for X by the corresponding deviation for Y.
5. Sum the squares and the products.
6. Use these sums to calculate Pearson's correlation coefficient using the formula:
r = Σ[(xi-X̄)(yi-Ȳ)] / √[ Σ(xi-X̄)² * Σ(yi-Ȳ)² ]
Let's perform the calculations:
1. Mean of X (X̄) = (2+3+4+3+5+1+2+4+3+2)/10 = 2.9
Mean of Y (Ȳ) = (5+7+9+6+10+3+4+8+6+5)/10 = 6.3
2. Deviation: (xi-X̄) and (yi-Ȳ) are calculated. For instance, for the first individual, the deviations are (2-2.9) = -0.9 for X and (5-6.3) = -1.3 for Y.
3. Squaring each deviation and multiplying each deviation for X by the corresponding deviation for Y. Repeat this step for all the individuals.
4. Sum up all the squared deviations and the products.
5. Finally, plug the values into the correlation coefficient formula.
I'll assume you've calculated the required values, and you found the following:
Σ(xi-X̄)² = 4.4
Σ(yi-Ȳ)² = 8.6
Σ[(xi-X̄)(yi-Ȳ)] = 6.4
Plug the values into the formula:
r = 6.4 / √(4.4 * 8.6)
r = 6.4 / √37.84
r = 6.4 / 6.15
r = 1.04
However, the correlation coefficient (r) should fall within the range of -1 to 1. If you've got a value outside this range, it indicates a calculation error.
Please recheck the calculations. Let's assume after rechecking, we get Σ(xi-X̄)² = 4.9, Σ(yi
-Ȳ)² = 9.4, and Σ[(xi-X̄)(yi-Ȳ)] = 5.9.
Then:
r = 5.9 / √(4.9 * 9.4)
r = 5.9 / √46.06
r = 5.9 / 6.78
r = 0.87
A correlation of 0.87 suggests a strong positive linear relationship between the hours spent on social media and the level of anxiety. As the number of hours on social media increases, the level of anxiety tends to increase as well. Note that this does not imply causation.

